
Dashboard
The community overview, its figure cards, its links and its charts.
The Dashboard is your home page in the partner panel. For a community organizer, it shows the overview of your community.
Open the dashboard
- Click Dashboard in the menu.
- Or open the partner panel address without a page name. XRaise opens the Dashboard.
The community overview
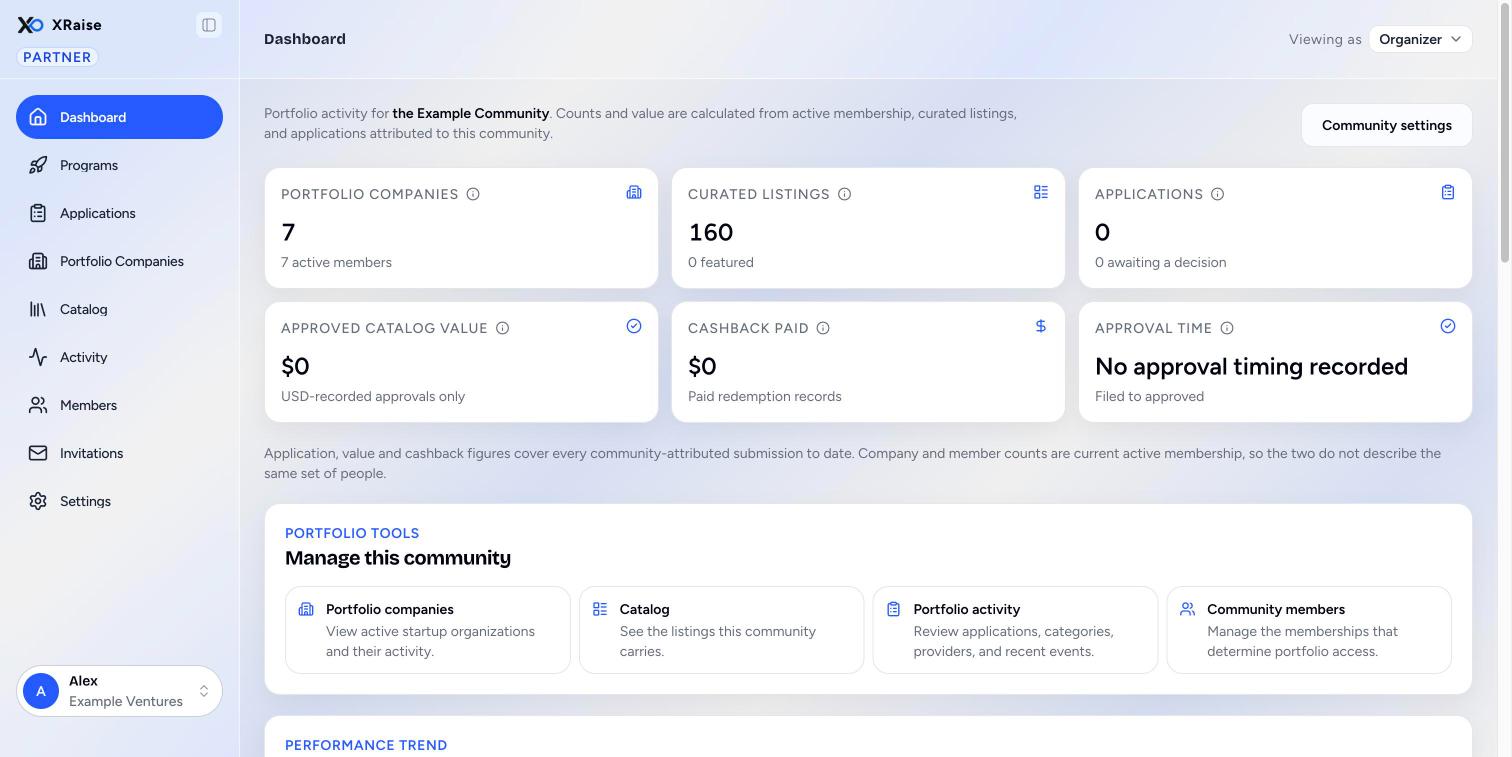
The overview is at /partner/dashboard and at /partner/community/(community id). It shows "Portfolio activity for (community name)." The counts and the value come from active membership, the listings in your catalog, and applications that came through your community.
The button Community settings opens Community settings.
The metric cards
Each card has an ⓘ that explains what it counts.
| Card | Figure | Note under the figure |
|---|---|---|
| Portfolio companies | Startup organizations with at least one active member of your community, now. The figure falls when people leave. | The number of active members. |
| Curated listings | Listings in your community catalog today. Removed listings are not counted. | How many are featured. |
| Applications | Every application that came through your community, for all time. | How many wait for a decision. |
| Approved catalog value | The sum of approvals that recorded a fixed USD amount. This is a floor, not a total: percentage discounts and programs record no amount. | "USD-recorded approvals only" |
| Cashback paid | Redemption records marked paid. Money that moved, never an estimate. | "Paid redemption records" |
| Approval time | The median time from filing to approval. Half of the approvals were faster, half slower. | "Filed to approved" |
Under the cards, a line explains that application, value and cashback figures cover all time, while company and member counts are current membership. The two do not describe the same set of people.
Manage this community
Five links open the community screens:
- Portfolio companies: "View active startup organizations and their activity." See Portfolio companies.
- Catalog: "See the listings this community carries." See Catalog.
- Portfolio activity: "Review applications, categories, providers, and recent events." See Activity.
- Community members: "Manage the memberships that determine portfolio access." See Members.
- Invitations: "Create and revoke the links that let people join." See Invitations.
The charts
| Panel | What it shows |
|---|---|
| Applications and approved value over 12 weeks | One pair of bars per week. Blue is applications. Green is approved value. The two colors use separate scales, so compare each color only with itself. Hover over a week to see applications, activations and approved value. |
| Application funnel | Interested, Applied and Awaiting a decision. Each percentage is against the stage above it, not against the total. |
| Time to approval | Approved applications grouped by how long they waited. The heading is the median. |
| Activations mix by category | The six categories with the most approvals, with approvals and applications. |
| Engagement by startup stage | The average engagement score (out of 100) of companies at each stage, with the number of companies and submissions. See Portfolio companies. |
| Top provider partners | The eight providers with the highest approved value in your community: applications, approvals and approved value. |
A panel with no data says so, for example "No weekly activity yet." If one panel fails to load, the others still show, and the failed one has a Try again button.
Common questions
Why do the company count and the application count not match? Company and member counts are current membership. Application figures cover all time, including people who left.